Bynder Analytics
Data-driven insights for your content
- Built in-house, tailored to your use case
- Data insights into asset performance
- High-level, analytic reporting
Why Bynder Analytics?
Unlock the data behind your content
Identify and improve bottlenecks in your creative workflows, brand portal adoption rates, and overall content performance. Make decisions on content and brand portal strategy backed up by data, not guesswork.
The ROI of Bynder is seen in the time it saves us, the increased number of assets in circulation, and the improved productivity of our design operations.


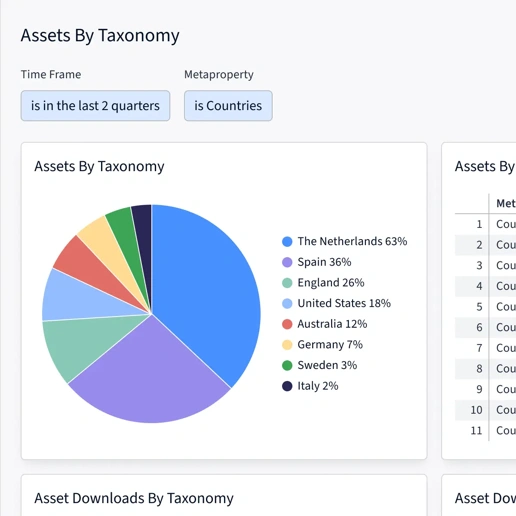


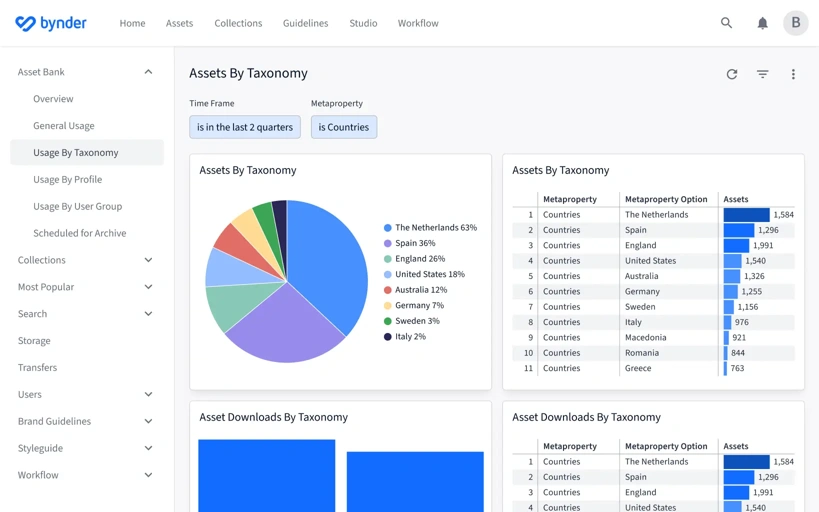
Intuitive interface for crystal-clear insights
Quickly find relevant insights through visual dashboards, filter for more specific information, and generate reports with a click of a button. Analytics provides the data you need to make data-driven decisions.


The right and relevant data for everyone
Analytics helps managers understand the portal’s performance and quickly generate reports to prove ROI.
Administrators are empowered to find ways to drive adoption for less-engaged users.
Brand and creative teams gain better insights on all creative jobs to highlight areas for improvement.
All of our departments have different challenges. The Bynder experience is helping us unify, IT optimize, and establish digital processes for the entire organization.


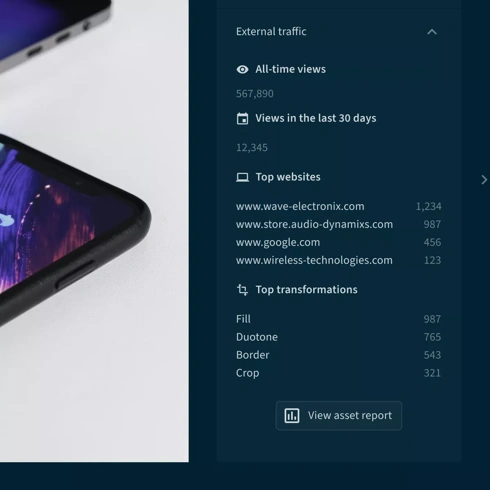
Track performance of assets used across channels
Access an unrivaled level of analytical detail for asset usage outside of the DAM. Track and trace asset data on external platforms and enable data-driven decision-making to optimize asset performance.


More products and add-ons
What is Bynder Analytics?
Drilling down into a digital asset management (DAM) system’s data can help you to get more value from your digital assets and understand how often content is used, in what way it’s being implemented across departments, and identify which content is relied upon most frequently.
Bynder Analytics can be used for a variety of purposes depending on your role and goal. For instance, marketing managers can get an overview of their most popular digital assets, while creative directors may be more concerned with the average duration of a project across different teams and countries.
To satisfy the needs of all Bynder users, Analytics is offered in a Light, Standard and Advanced package. Light provides general insights and reporting capabilities, whereas Standard and Advanced allows users to focus even more on the exact metrics that their organization is interested in.
What are the benefits of using Bynder Analytics?
Bynder Analytics helps teams deliver the ethos of content quality, not quantity. The visually intuitive content analytics dashboard helps companies unlock the valuable data behind their content so they can:
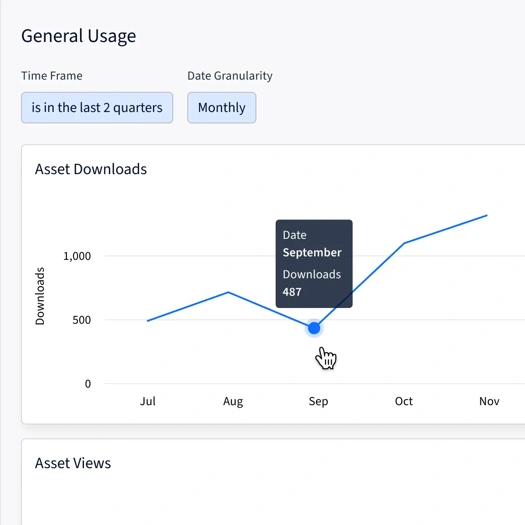
Measure internal content usage
With data on content views and downloads, users can find out which types of content are being used the most across the various departments and regions.
Demonstrate ROI
The ‘Most popular’ feature helps to identify the most valuable content and campaigns in an instant, with reporting capabilities to help back up your decisions with easily digestible data.
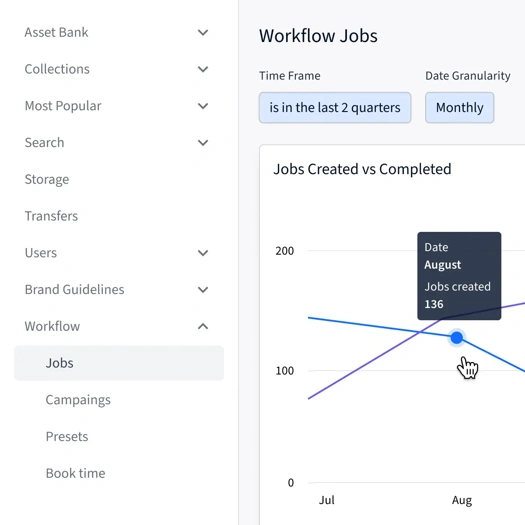
Track the progress of jobs
By following the progress of creative projects, including number of outstanding jobs, assets created, project stage, and users responsible, it’s easier for managers to recognize potential bottlenecks in a creative project, ultimately ensuring a much quicker time-to-market for content.
Pinpoint ineffective content
Measuring the popularity of assets stored in the portal helps teams see what’s working and what’s not. By recognizing files that are being neglected or underused, it’s clearer where you need to optimize or even remove particular content pieces.
Get an overview of what keywords are being used
By getting an insight into what search terms are typically used throughout the company, you can see what kind of content is most often accessed, and organize accordingly.
Ultimately, Bynder Analytics is about helping users discover the actual value of digital assets—backed up by data—within their Bynder portal, empowering better decisions, and better content.
See what Bynder can do for you
Our in-house experts can walk you through everything you need to know.
Book a demo Free 30-day trial