


These days, marketers are shipping out content faster than ever before—with 30% of total marketing budgets devoted to content creation. Yet, a whole lot of content means a whole lot of competition for modern brands when trying to cut through the noise and strike a chord with consumers.
Not only that, but it’s a common problem that while content is being created thick and fast, it’s all too often underused (if it’s even used at all.) The result? A real drainer on time, money, and valuable creative resources.
Answering the call for greater clarity on what content is actually working
Bynder is all about simplifying the management of content operations, ultimately helping brands deliver content that is always consistent and of the highest quality. That’s why we’re answering the call from our customers and the industry at large by introducing Bynder Advanced Analytics.
This feature enables teams to easily track how the Bynder portal is being used throughout their company, while also providing users with the data they need to see how often content is used, in what way it’s being implemented across departments, and identify which content is relied upon most frequently.
“Traditionally, with no insight into asset usage, marketing teams have been focused on creating as much branded content as possible,” said Chris Hall, CEO of Bynder.
“With Advanced Analytics, they now have the insights to create only valuable and strategic content that demonstrates ROI, without wasting time and money on digital content that doesn’t get used. We want our customers to get the most mileage possible out of each and every asset. This is our solution to ensure brands are creating impactful content and getting the most use out of their investment.”
How does Bynder Analytics help exactly?
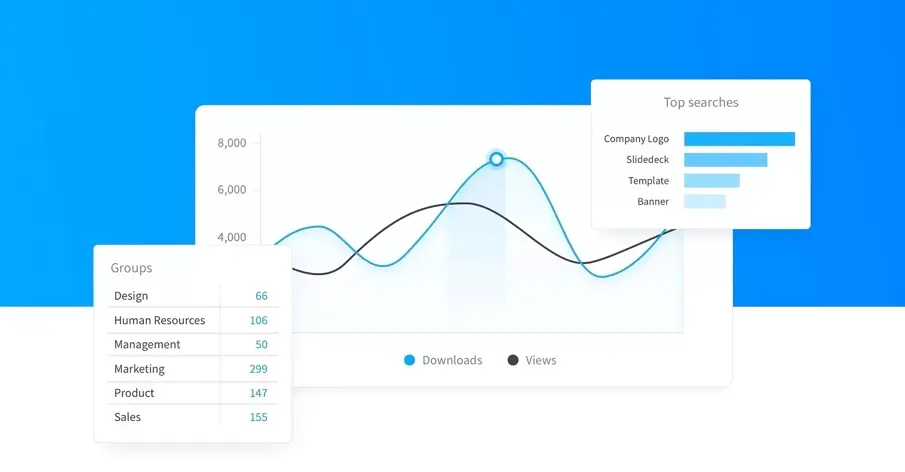
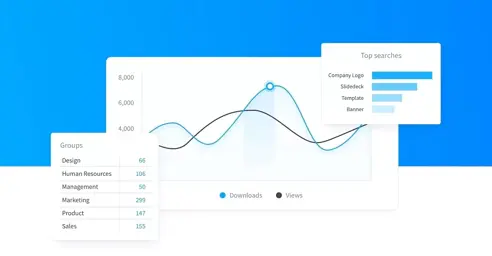
We want to help brands deliver the ethos of content quality, not quantity. The visually intuitive content analytics dashboard helps companies unlock the valuable data behind their content so they can:
Measure internal content usage
With data on content views and downloads, marketing managers can find out which types of content are being used the most across the various departments and regions.
Prove ROI
The ‘Most popular’ feature helps to identify the most valuable content and campaigns in an instant, with reporting capabilities to help back up your decisions with easily digestible data.
Track the progress of jobs
By following the progress of creative projects, including number of outstanding jobs, assets created, project stage, and users responsible, it’s easier for managers to recognize potential bottlenecks in a creative project, ultimately ensuring a much quicker time-to-market for content.
Pinpoint ineffective content
Measuring the popularity of assets stored in the portal helps teams see what’s working and what’s not. By recognizing files that are being neglected or underused, it’s clearer where you need to optimize or even remove particular content pieces.
Get an overview of what keywords are being used for searches
By getting an insight into what search terms are typically used throughout the company, you can see what kind of content is most often accessed, and organize accordingly.
Altogether, Bynder Analytics is about helping users discover the actual value of digital assets—backed up by data—within their Bynder portal, empowering better decisions, and better content.
For more information on the exact features and functionality of Bynder Analytics, check out our product page here.
Book a demo with our experts and see Bynder Analytics in action
If you'd like a walkthrough of the Bynder platform with one of our experts, why not sign up for a demo? We will give you a demonstration of the features & functionality that you think may fit your team's needs, as well as answer any questions you may have about using Bynder.