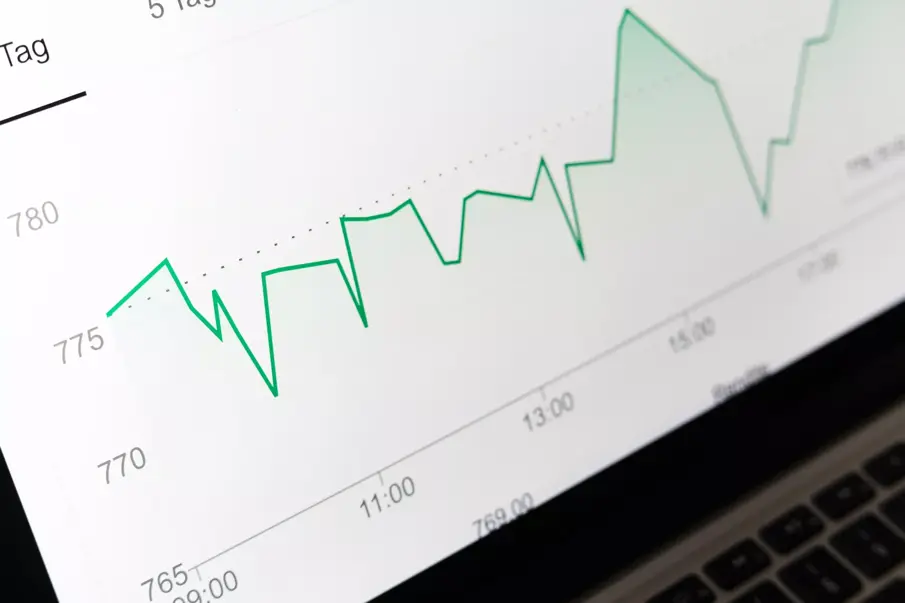
Many businesses are just starting to truly understand the real value of analytics when it comes to online marketing and the business user. As an growing industry, the potential of online analytics is continuously evolving thanks to new features and more-detailed reports. At its core, analytics is all about hard data: page clicks, search terms, page-to-page flow, time-on-page, and other statistics give all of the details about a person’s experience. It goes beyond web analytics too, as DAM and PPC systems often come with their own analytics suite to provide an even closer look.
Numbers, though, are only part of the picture. As for the value of analytics, think of it as all of the evidence in a criminal case . But instead of fingerprints, phone records, and a weapon, we have data that tells us where the users came from, how long they stayed, and what they found most interesting. How does this work?
The first step is setting up your analytics. Without that, you’re looking at a blank page. Once your analytics are up and running, you’ll need to give them time to breath and collect an appropriate sample size. For the obsessive-compulsive type, it’s really tempting to check every five minutes, but trust me when I say that this will eventually drive you into convulsions. Try to give it a daily, if not weekly view to breakdown an active campaign.
When you’ve got your sample size, that’s when the fun begins. Data can be drilled down into specific segments — for example, you can look at only users that came in from search or referral sources. You can see if a there’s a pattern for how they went from entry to call-to-action…or if the data is scattered, it might be fate telling you to sharpen up the messaging. And if you need further details to be sure, consider looking past just website analytics.
One option is to use Bynder’s Digital Asset Management analytics, which offers an effective complement to their website-focused cousin. Depending on your system, DAM analytics can provide data on everything from individual user activity to what digital assets are being downloaded the most. For example, if a particular image is getting more downloads than others, you can break down the data to see what is causing the spike. Is it related to some sort of bigger trend? Is it used by a specific group of people? Did the spike come and go on a certain day or has it stayed consistent?
Usage data is one of the biggest keys to understanding your target audience. If you find that people are creating traffic for the wrong reasons, such as unrelated search terms. However, if you are seeing a consistent connection between a specific page or asset and a call to action, then your marketing efforts have produced results. And the data from successful conversions can act as a starting point for future campaigns. On the flip side, data from disastrous campaigns offers an autopsy of how and why you didn’t get the results you wanted and what you could correct in the future.
What is the value of web analytics? For marketing departments, it’s about finding the numbers that define that all-important sweet spot of when window shoppers become buyers. Utilize all of the data you can get your hands on, including social analytics. After all, if history has taught us anything, it’s that in the end, the numbers don’t lie.
Monitor analytics for your digital assets and rich media with Bynder, a robust cloud-based digital asset management system. See how you can start doing this by signing up for a quick demo.
